In this page I have compared the predicted performance of several candidate
airfoils for the KR-2S. Among them are the RAF48, the NLF(1)0115 and four
new airfoils. The predicted performance for all the airfoils has been obtained
by analyzing them using XFOIL, a program written by Prof. Mark Drela of
MIT. The four new airfoils have been chosen as the best of several that
I have designed over the past few weeks. These new airfoils were designed
using PROFOIL (a limited version of PROFOIL is available on the web as PROFOIL-WWW),
an inverse airfoil design program written by Prof. Michael Selig and MFOIL,
a MATLAB graphical user interface that I created for designing airfoils
with PROFOIL.
Along with the airfoil performance, I have also included some of the
results from my analyses of the effect of these airfoils on the aircraft
performance. Assumptions have been made for the drag characteristics of
the baseline airplane (with the RAF48 airfoil for the wing) and the engine
and propeller performance. With these assumptions, the effect of changing
the wing airfoil on the power characteristics, rate of climb, angle of
climb, top speed, range and endurance has then been studied.
As seen from the drag polars, the NLF(1)0115 airfoil has a significantly
lower drag at a Cl of 0.3, but it has higher drag than the RAF48
a higher Cl values. The predicted Clmax for the NLF(1)0115
is nearly 1.6 and for the RAF48 is 1.5.
How does one decide whether it is worthwhile trading off lower drag
at high Cl conditions for lower drag at the low Cl
conditions? Put another way, by switching from the RAF48 to the NLF(1)0115,
it is quite obvious that lower drag can be expected at cruise conditions
(low Cl), resulting in higher range for a given fuel quantity.
But will this switch result in a significant loss in the rate of climb
and angle of climb at low speeds (high Cl)? Perhaps the best
way to answer this question is by examining the effect of these drag polars
on the aircraft performance.
| Assumptions made in calculating the baseline performance with
the RAF48 airfoil for the wing
Standard sea level
q = 0.5*rho*(V^2) = dynamic pressure; where rho = air density, V = flight speed D = Drag = parasite drag + induced drag = f.q + (K/pi)*((W/b)^2)/q =
baseline drag
Change in performance due to change in airfoil D = baseline drag + DCd*q*S,
Power required = DV Other assumptions
Engine SFC = 0.5 (lb of fuel consumed/hr)/BHP
|
To determine what happens to the performance when I change the wing airfoil from the RAF48 to the NLF(1)0115, I have taken the drag difference between the two polars from the XFOIL predictions, and translated that difference into a difference in the power required for level flight. As expected, the NLF(1)0115 performs better than the RAF48 at high speeds, but does not perform too badly in comparison with the RAF48 at the low-speed end. The reason, of course, is that the induced drag plays a much larger contribution in determining the low-speed performance than does parasite drag. This illustration shows that while designing a new airfoil to improve on the RAF48, it is important to concentrate on decreasing the drag at low Cl values even at the expense of slightly higher drag at high Cl conditions. To further examine the effects of the airfoil on the aircraft performance, the climb and cruise performance with the two airfoils are shown in Figs. 2(b) and 2(c).
The climb rate and the climb angle estimates with the RAF48 and the NLF(1)0115 airfoils can be seen in Fig. 2(b). As seen from the figure, the lower drag for the NLF(1)0115 at higher speeds results in better climb rates at those speeds. The best rate of climb has not changed significantly by using the NLF(1)0115 instead of the RAF48. The RAF48 does have a small advantage at the lower speeds, but the advantage is minor for both climb rate and climb angle. The figure also provides information on the effect on the maximum cruise speed. Maximum cruise speed corresponds to the speed at which the R/C becomes zero. From the figure, the maximum cruise speed is about 2 mph higher for the NLF(1)0115 than for the RAF48. While this result may be somewhat surprising, the reason for this result is that the Cd for the two airfoils are nearly identical at a Cl value of 0.15, which corresponds to the top speed.

As mentioned earlier, the estimates for range and endurance do not take
into account that the airplane weight decreases with flight time. The reason
for this omission is to simplify the calculations. Again, the emphasis
here is on the effect of the airfoil on the performance rather than on
the absolute performance of the airplane.
As seen from Fig.2(c), there is a significant improvement in the range
at high speeds with marginal loss of endurance at low speeds. Given the
role of this airplane, the loss in endurance by using the NLF(1)0115 instead
of the RAF48 is considered inconsequential.
The effect of the 22A and the NLF(1)0115 airfoils on the aircraft performance
is compared with that of the RAF48 (baseline) in Figs. 4(a)-(c). These
figures are similar to Figs. 2(a)-(c)
From the three figures, it can be seen that the aircraft predicted
performance is equal or better everywhere with the 22A airfoil than with
the NLF(1)0115 airfoil. In particular, from Fig. 4(b), the maximum cruise
speed (the speed at which the R/C goes to zero) for the new airfoil 22A
is significantly better than for the NLF(1)0115 and the RAF48 airfoils;
about 10 mph higher than with the RAF48 and about 8 mph higher than with
the NLF(1)0115.
As seen from Fig. 5, the 20D airfoil has a more negative pitching moment
than the 22A. Notice that for both the airfoils, the lower corner of the
polar has not changed. The reason is that the Cl value for the
lower corner of the polar was a design specification; this Cl
value was fixed at 0.1 for both the airfoils. Except for a small reduction
of the low-drag range for the 20D, the polars for the two airfoils are
nearly the same. The biggest effect of allowing a more negative (nose down)
value for the pitching moment is an increase in the Clmax. By
going from a Cm of -0.055 to -0.075, the predicted Clmax has
increased from about 1.62 to about 1.65.
The effect of the 20D airfoil on the aircraft performance has not been
included as the curves for the 20D are nearly identical to those for the
22A.
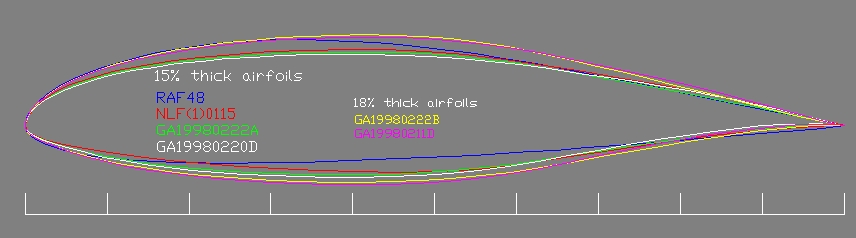
As seen from Fig. 6, the 22B and the 22A both have the lower corner of the drag polar at a Cl of 0.1. Also both these airfoils have nearly the same pitching moment values. As explained earlier, these are both common design requirements for the two airfoils. The most noticeable characteristic of the 18% 22B is the much wider low-drag range, stretching from a Cl of 0.1 to 0.8, as opposed to a range from Cl of 0.1 to 0.55 for the 15% airfoils. However, at high Cl values (of about 1.3), the 22B has a much larger drag than the 15% airfoils. Also the predicted Clmax for the 22B is about 0.1 less than that for the thinner 22A.
As we saw earlier, the aircraft climb and cruise performance is relatively
insensitive to higher drag for the wing airfoil at high values of Cl.
In the Figs. 7(a)-7(c), the high-drag behavior of the 22B at high Cl values
does not even show up, as this condition corresponds to speeds of less
than about 65 mph. It should be realized, however, that this high-drag
behavior for the 22B at high Cl is caused by flow separation
at the trailing edge of the upper surface. Examination of the boundary
layer characteristics for the 22B, as predicted by XFOIL, shows that the
flow begins to separate at the trailing edge of the upper surface at a
Cl of about 1.0, and very gradually moves forward until at a
Cl of about 1.5, the aft 30%-40% of the airfoil is separated.
While this results in an extremely soft stall, with ample warning, such
an airfoil, when used in the outer portions of the wing may results in
somewhat ineffective ailerons at high alphas. However, when used in the
root regions of the wing in combination with the 15% 22A airfoil at the
tip, it is possible that the gentle stall of the 22B can be utilized to
good advantage. The soft stall and the associated trailing edge flow separation
for the 22B at high alpha can provide ample stall warning, while the thinner
airfoils with a higher Clmax at the tip can continue to provide
good aileron effectiveness and stall margin.
It may be worthwhile trying to design another 18% airfoil which does
not have such a high-drag behavior at high values of Cl. One
candidate is the 18% GA19980211D, which has the same design philosophy
as for the 22B, except that the 11D has a more negative pitching moment
of Cm = -0.075.
As seen from Fig. 8, the 18% 11D has a more negative pitching moment
as well as a slightly higher Clmax and lower drag at high values
of Cl than the 22B airfoil.
I am planning to work on the design of more 18% thick airfoils in the
next few days. During this design effort, I'll be focusing on reducing
the trailing-edge flow separation at high angles of attack.
(a) |
(b) |

(c) |
(d) |
(e) |

(f) |
The Ashok Gopalarathnam/Selig 15% airfoil AS5045 was arrived at after
considerable tweaking of the GA19980222A. The design philosophy included
prescribing laminar and turbulent boundary characteristics over different
portions of the airfoil at their design operating conditions in a multipoint
fashion.
The following figures compare the predicted aerodynamic characteristics
of the AS5045 with those for (1) the GA19980222A and (2) the RAF48. As
done earlier, all of the airfoil predictions have been made for a reduced
Re of 2 million.
As seen from Fig. 11, the AS5045 is an improvement over the GA22A at both the low-Cl end and the high-Cl ends of the polar. There is a small increase in the pitching moment (more negative) for the AS5045 at the higher values of Cl. The slight "kink" in the drag polar for the GA22A at the upper end of the drag-bucket (Cl of 0.5) has also been smoothed out.
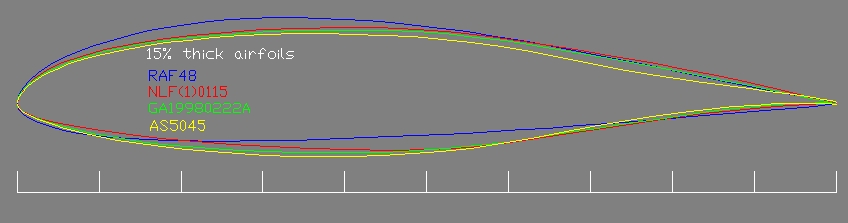
As seen from the geometries, the new airfoil has lesser camber than
all the other 15% airfoils in the figure. Also the trailing edge region
of the airfoil has been made thinner. The AS5045 has a blunt trailing edge
(1/8" thick for a 50" chord) to make it easy to build.
| AS5045 | AS5048 | |
| t/c | 15% | 18% |
| Cd at cruise (Cl = 0.1, Re = 5.6 million) | <0.005 | <0.005 |
| Clmax (Re = 1.5-2 million) | 1.3 | 1.25 |
| Clmax | not dependent on extensive laminar flow (not highly sensitive to roughness) |
not dependent on extensive laminar flow (not highly sensitive to roughness) |
| Cmo | -0.055 | -0.06 |
The models have not yet been digitized. We expect to digitize the models using a coordinate measuring machine in September 1998. No wind-tunnel corrections have been applied to the data yet.
The key focus of the tests were to obtain experimental verification of the Clmax, stall characteristics and the effect of roughness on the stall behavior. Owing to limitations on the maximum tunnel speed, the maximum Re that could be achieved with an 18" chord model in this tunnel is around 1.8 million. For the airplane wing, this Re corresponds to the Clmax condition. Re values for cruise condition for the wing in flight are much higher than 1.8 million, and cannot be measured in the tunnel.
The following observations can be made from the figures:
| Re (million) | Clmax | amax (deg) | Cm (nominal) | Stall type |
| 1.0 | 1.2 | ~14 | -0.05 | gentle |
| 1.5 | 1.25 | ~14 | -0.05 | gentle |
| 1.8 | 1.28 | ~14 | -0.05 | gentle |
Figure 4 (test_res1.gif) compares the data for Re of 1, 1.5 and 1.8 million with the results predicted by XFOIL for Re of 1, 1.5 and 2 million. It is seen that the Clmax is much less than that predicted by XFOIL. This behavior was expected. It was known even before the design of these airfoils that XFOIL consistently over predicts Clmax (at least for airfoils of this class). For example, Fig. 5 (compare_nlf0215_3m.gif) compares the XFOIL predictions for the NASA NLF(1)0215 airfoil with the experimental results from tests done at NASA. While the XFOIL predictions for the low Cl agrees quite well with the NASA data, the XFOIL predicted value of Clmax is about 0.25 higher than that obtained from experiments. Other comparisons (not shown here) show that the XFOIL-predicted Clmax is sometimes up to 0.3-0.4 higher than that obtained from experiments. During the design of the airfoil, this tendency of XFOIL to over predict Clmax was taken into account and it was expected that the airfoil Clmax would be around 1.3-1.4. The more important design goals related to stall were that the stall be gentle and that Clmax of this airfoil be not less than that of the RAF-48 and the NLF(1)0115. Because experimental results for the RAF-48 and the NLF(1)0115 are not available, it is not possible to verify this goal. It is expected that although XFOIL over predicts Clmax, the differences in Clmax from one airfoil to another should still be correctly predicted. As shown below, these goals have been satisfied (based on XFOIL predictions for the AS5045, the NLF(1)0115 and the RAF48 airfoils).
Effect of leading-edge trips on the AS5045 performance
To test the effect of leading-edge roughness on stall characteristics, the
performance of the airfoil was tested with leading-edge trips. Three types of
tape were used:
These results emphasize the need to keep the wing (the leading edge in particular) free of bugs and contamination. While it is hoped that small roughness elements will not significantly decrease Clmax, there is a decrease in Clmax with increasing size of the leading edge roughness. This decrease in Clmax with increasing size of the roughness element is expected. The design philosophy used for the AS5045 and the AS5048 minimize this decrease in Clmax with increasing roughness size. For this reason, it can be expected that the stall speed will increase with large roughness (in rain, for example). For example a decrease in Clmax of 0.2 results in a stall-speed increase of roughly 5 mph. Therefore, airspeeds should be increased by at least 5-10 mph when flying close to stall in rain or with leading edge roughness.
| Re (million) | Clmax (drag rise) | amax (deg) (drag rise) | Cm (nominal) | Clmax (peak lift) | amax (deg) (peak lift) | Stall type |
| 1.5 | 1.15 | ~13 | -0.045 | 1.28 | ~16 | gentle |
| 1.7 | 1.15 | ~13 | -0.045 | 1.25 | ~15 | gentle |
The following recommendations are made regarding the use of the AS5045 and the AS5048 airfoils on the modified KR-2S airplanes:
Full-size airfoil templates were drawn up on CAD for two of the new airfoils using coordinates resulting from the design effort.. They are shown fitted to KR2 spars using standard spar construction methods. The AS5045 was too thin at the main spar to fit the "stock" KR main spar, so the very similar AS5046 was created. These templates have been output to Adobe Acrobat PDF files and donated to public domain for free download, at http://www.krnet.org/AS504x/templates.html .
KRNet would like to thank Dr. Ashok Gopalarathnam, Dr Michael Selig, and
the staff of UIUC Applied Aerodynamics
Department for their outstanding efforts during the creation of these new
KR2S airfoils.